 2026-10-07
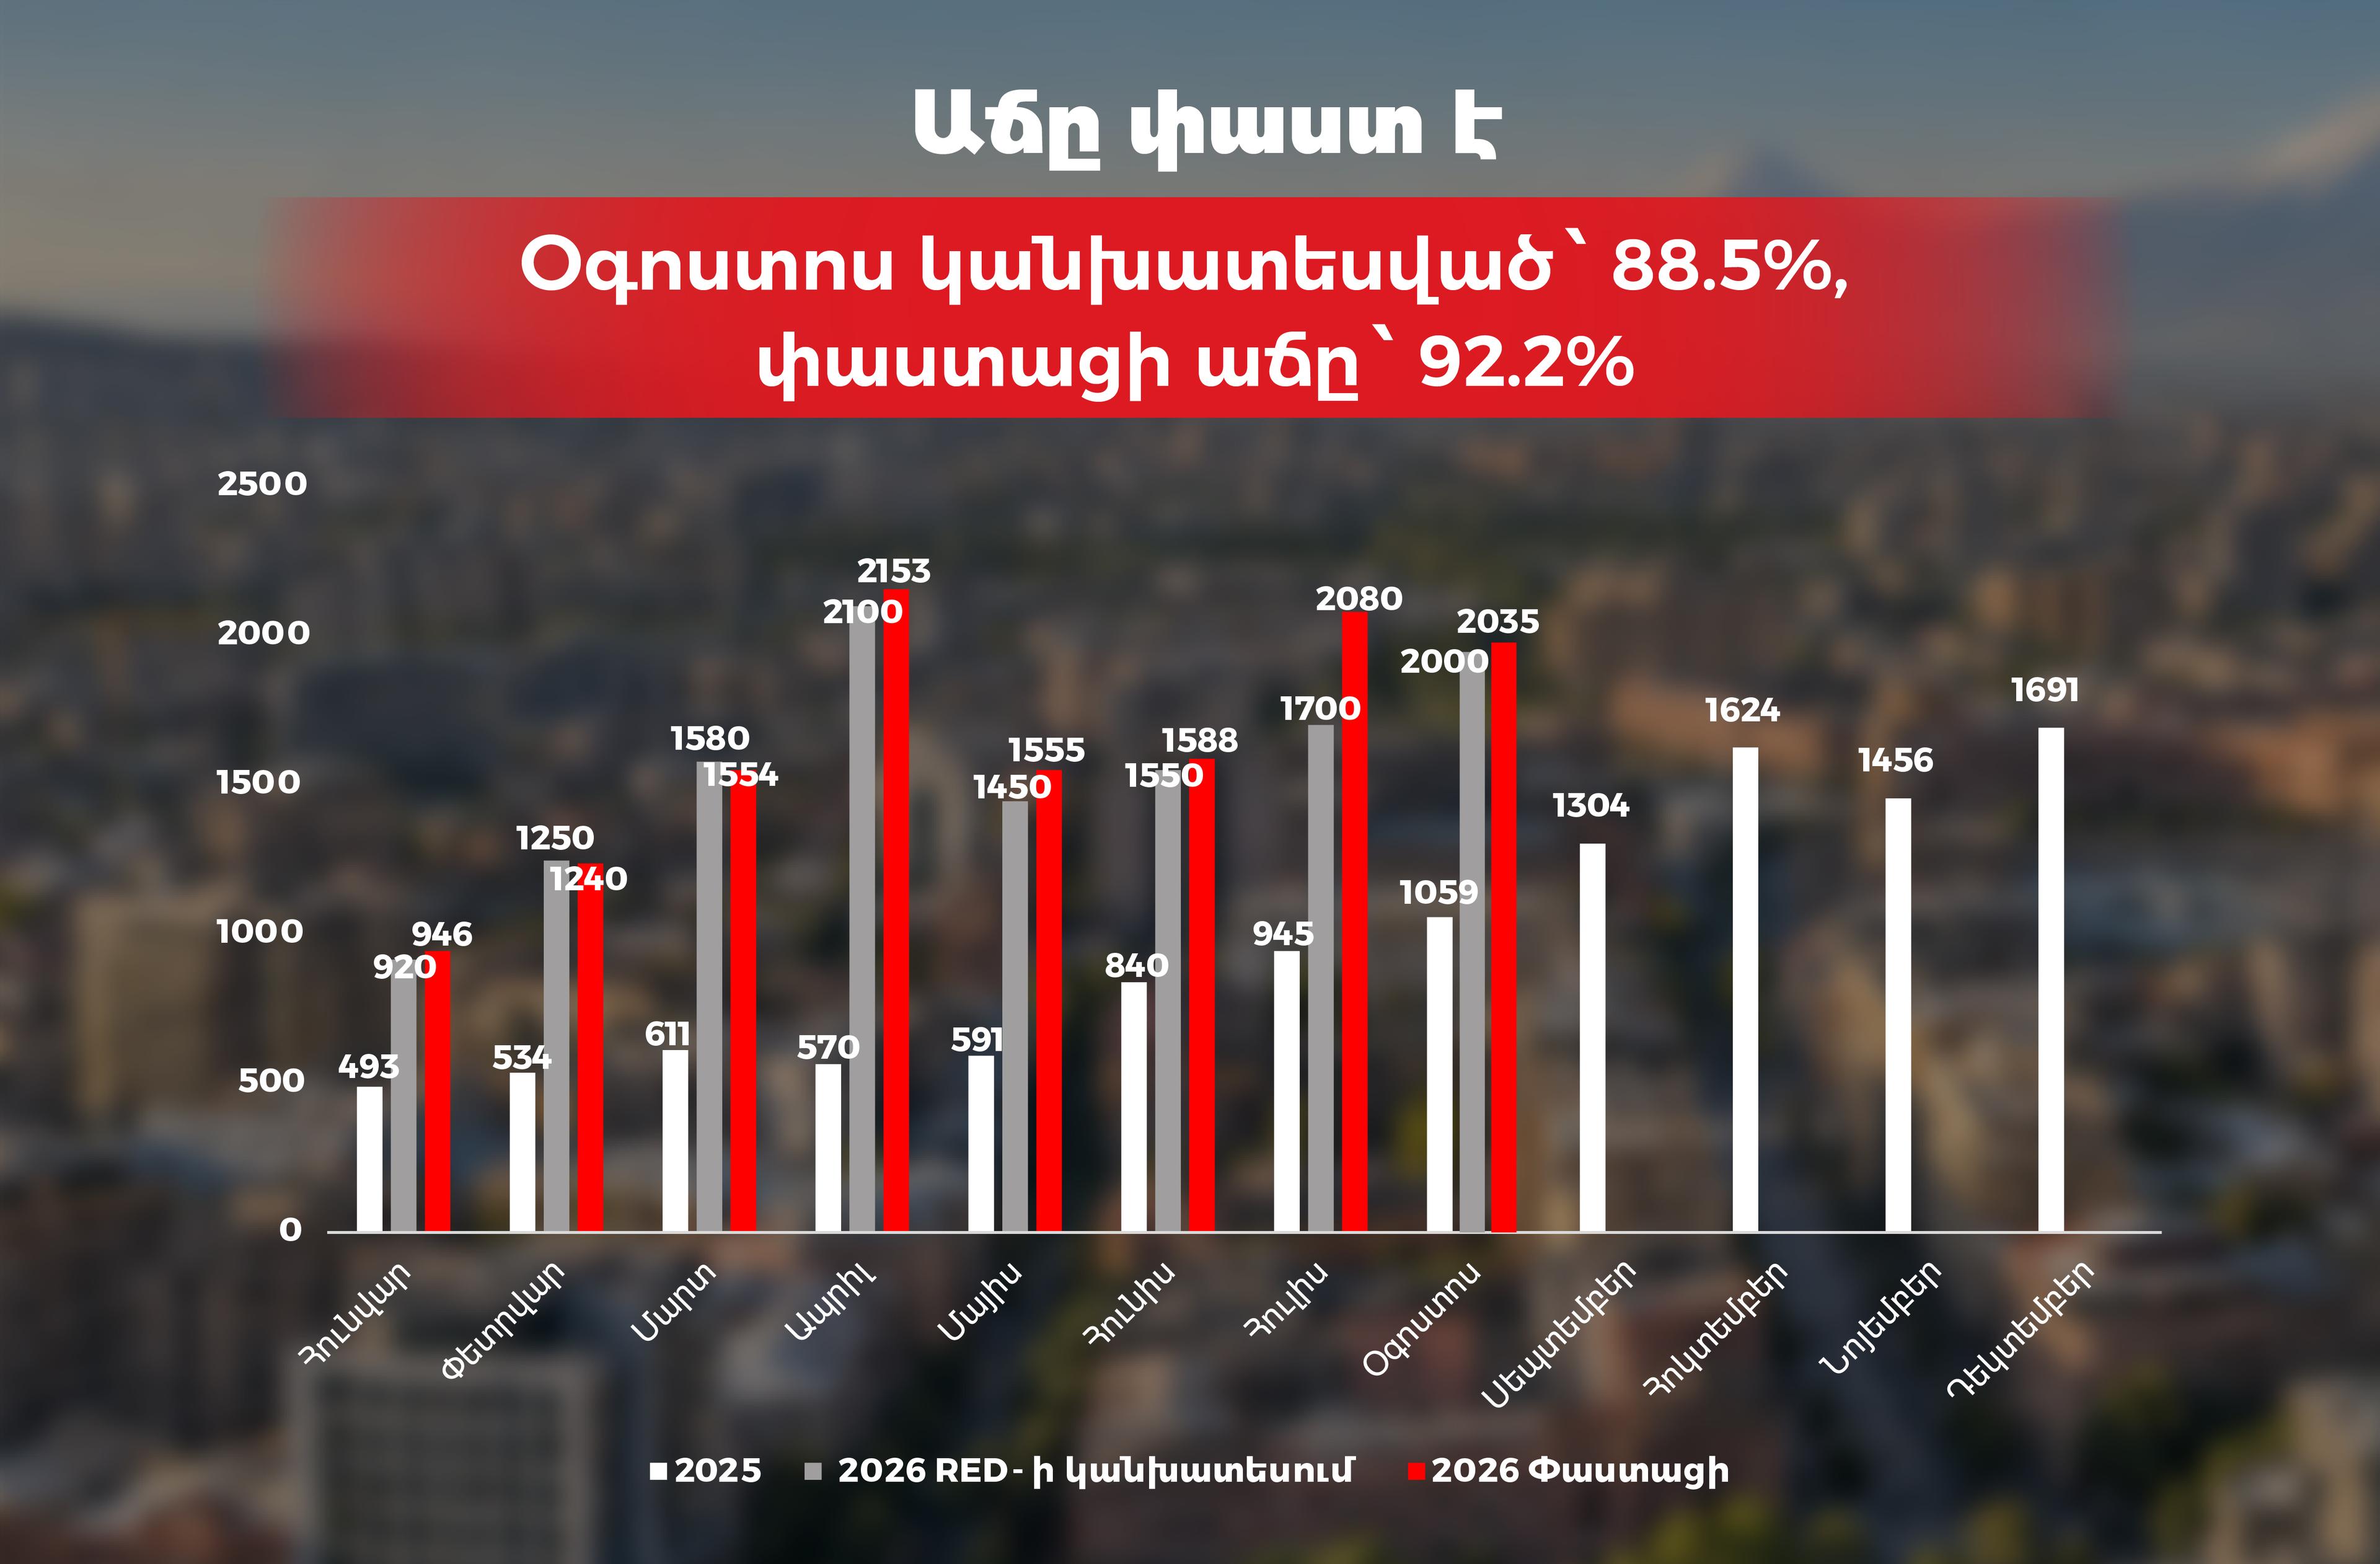
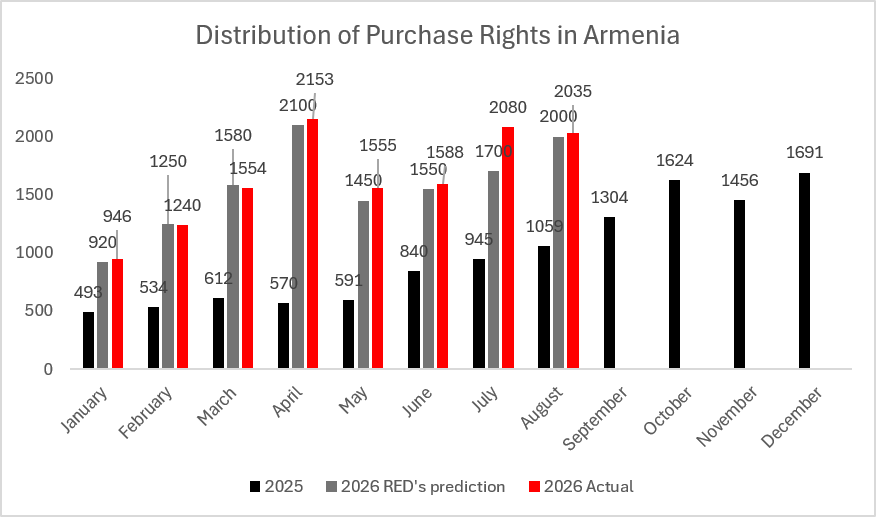
In August 2026, Armenia recorded 2,035 purchase-right transactions for apartments in residential buildings under construction. Compared with 1,059 transactions in August 2025, the annual increase amounted to 92.2%, exceeding the previously forecast growth of 88.85%.
Of the 2,035 transactions, 1,121, or 55.1%, were registered in Yerevan. This result is particularly important given the pessimistic expectations of a sharp decline in activity in Yerevan’s primary real estate market after the full implementation of territorial restrictions under the mortgage interest income tax refund program. The actual August data do not indicate such a sharp decline.
| Indicator | Value |
|---|---|
| August 2025 | 1,059 transactions |
| Forecast for August 2026 | 2,000 transactions |
| Actual result for August 2026 | 2,035 transactions |
| Forecast annual growth | 88.85% |
| Actual annual growth | 92.2% |
| July 2026 | 2,080 transactions |
| Change compared with July | -2.2% |
| Transactions in Yerevan | 1,121 |
| Yerevan’s share | 55.1% |
| Transactions in the regions | 914 |
| Share of the regions | 44.9% |
In August 2025, Armenia recorded 1,059 purchase-right transactions, while the actual result for the same month in 2026 reached 2,035. The number of transactions increased by 976 within one year, corresponding to annual growth of 92.2%.
According to RED Invest Group’s preliminary forecast, approximately 2,000 transactions, or 88.85% annual growth, were expected in August. The actual result exceeded the forecast by 35 transactions, or 1.75%.
However, the main outcome of the month is not only that the forecast was exceeded. More importantly, Armenia’s primary real estate market maintained a level of more than 2,000 transactions for the second consecutive month.
Armenia recorded 2,080 purchase-right transactions in July 2026 and 2,035 in August. The monthly difference was 45 transactions, representing a 2.2% decline.
This slight decrease does not provide clear evidence of weakening market activity. The number of transactions exceeded 2,000 in both July and August, indicating relative stabilization at a high level.
The market recorded 2,153 transactions in April 2026, followed by 1,555 in May and 1,588 in June. Activity then increased to 2,080 in July and remained close to the same level in August.
Therefore, the dynamics following the April peak should be viewed as stabilization with monthly fluctuations rather than as a continuous decline. Activity remains significantly higher than in the previous year.
According to KOMO Stats, 1,121 apartment purchase-right transactions were registered in Yerevan in August 2026. The capital recorded 1,211 transactions in July, meaning that the monthly decline amounted to 7.4%.
Despite the monthly decrease, Yerevan continued to account for the majority of Armenia’s purchase-right transactions. The capital represented 55.1% of the national total in August.
This result is particularly significant in the context of territorial restrictions under the mortgage interest income tax refund program. For new mortgage loans issued after January 1, 2025, the restrictions were fully extended across Yerevan’s administrative territory, subject to the exceptions established by law.
According to the official clarification of Armenia’s State Revenue Committee, the restrictions do not apply to projects constructed under building permits issued by decisions adopted before January 1, 2022. They also do not affect the continued refund of income tax under mortgage loans obtained before the corresponding restrictions took effect.
Before the full implementation of these restrictions, pessimistic expectations suggested that Yerevan would experience a sharp decline in primary market activity. However, the 1,121 transactions recorded in August and Yerevan’s 55.1% share show that such a sharp decline did not occur during the observed month.
According to the Cadastre Committee of the Republic of Armenia, 914 purchase-right transactions were registered in the regions in August 2026. They represented approximately 44.9% of the national total.
This distribution shows that market activity is not concentrated solely in Yerevan. Nevertheless, the capital continues to hold the largest individual share of Armenia’s primary real estate market.
Kotayk Province accounted for the largest number of regional transactions, with 694 purchase-right registrations in August. It was followed by Armavir with 108, Ararat with 66 and Aragatsotn with 24 transactions.
The August result indicates that demand in Yerevan’s primary real estate market was not entirely dependent on the income tax refund program. The market is gradually adapting to new regulations and changing financing conditions.
Factors potentially supporting market activity include:
According to RED Invest Group’s analysis of the impact of installment payment models, phased and long-term payment options reduce the buyer’s initial financial burden and expand opportunities to enter the market.
These factors have not been measured as having a direct causal relationship with the number of transactions recorded in August. They are presented as possible contributors to the continued level of market activity.
The August 2026 data reveal three main trends:
Annual growth remains high.
The number of transactions increased by 92.2% compared with August 2025.
The market remained above 2,000 transactions.
Armenia recorded 2,080 transactions in July and 2,035 in August.
The expected sharp decline in Yerevan did not occur.
The capital recorded 1,121 transactions, representing 55.1% of Armenia’s total.
The 2,035 purchase-right transactions registered in Armenia in August 2026 exceeded the result for the same month of the previous year by 92.2%. The actual growth rate was also higher than RED Invest Group’s preliminary forecast of 88.85%.
The 2.2% decrease compared with July did not change the broader picture. The market remained above 2,000 transactions for the second consecutive month.
Yerevan’s result is particularly significant. The 1,121 transactions registered in the capital represented 55.1% of Armenia’s total. This indicates that the sharp decline expected after the full implementation of territorial restrictions under the income tax refund program did not occur during the observed month.
At the same time, one month of data is not sufficient to confirm a long-term structural shift. Yerevan’s market stability should therefore be assessed by monitoring transaction dynamics over the following months.
The article analyzes state-registered purchase rights for apartments in residential buildings under construction.
The analysis does not cover all types of real estate transactions, such as standard sales, donations, leases or mortgages. It focuses exclusively on registrations of rights to purchase apartments in residential buildings under construction.
| Data | Value | Source |
|---|---|---|
| August 2025 | 1,059 | RED Invest Group: August 2025 Real Estate Market Analysis |
| July 2026 | 2,080 | Cadastre Committee: Real Estate Market Analysis for August 2026, Section 6.1 |
| August 2026 | 2,035 | Cadastre Committee: Real Estate Market Analysis for August 2026, Section 6.1 |
| Yerevan, August 2026 | 1,121 | KOMO Stats: Purchase-Right Transactions in Yerevan |
| Yerevan, July 2026 | 1,211 | KOMO Stats: Purchase-Right Transactions in Yerevan |
| Regions, August 2026 | 914 | Cadastre Committee: Real Estate Market Analysis for August 2026, Section 6.1 and Table 6.1-1 |
| Income tax refund restrictions | — | Official Clarification by the State Revenue Committee |
| Legal regulation | — | ARLIS: Law No. HO-291-N |
| Impact of installment payments | — | RED Invest Group Analysis |
The complete archive of real estate market reports is available in the Cadastre Committee’s Market Analysis section.
Annual Growth
(2,035 - 1,059) / 1,059 × 100 = 92.16%
Rounded annual growth: 92.2%.
Change Compared with July
(2,035 - 2,080) / 2,080 × 100 = -2.16%
Rounded monthly change: -2.2%.
Difference Between the Actual Result and the Forecast
(2,035 - 2,000) / 2,000 × 100 = 1.75%
The actual result exceeded the forecast by 35 transactions, or 1.75%.
Yerevan’s Share
1,121 / 2,035 × 100 = 55.09%
Rounded share of Yerevan: 55.1%.
Share of the Regions
914 / 2,035 × 100 = 44.91%
Rounded share of the regions: 44.9%.
The information presented in the article is divided into three categories:
Yerevan’s 55.1% share shows that the capital continued to account for more than half of purchase-right transactions in August 2026. However, one month of data is not sufficient to confirm a long-term structural change.
Authors: Serzh Nazaryan and Vardan Eloyan
Calculations and analysis: RED Invest Group
Tool used: ChatGPT
ChatGPT was not used as a source of statistical data. The factual indicators presented in the article were obtained from the cited sources, while the calculations and analytical conclusions were reviewed and developed by the authors.


