


Download the RED Invest app


Scan with your phone camera to download the app
© RED Invest Group 2026.
Download the RED Invest app
Scan with your phone camera to download the app
 2026-11-11
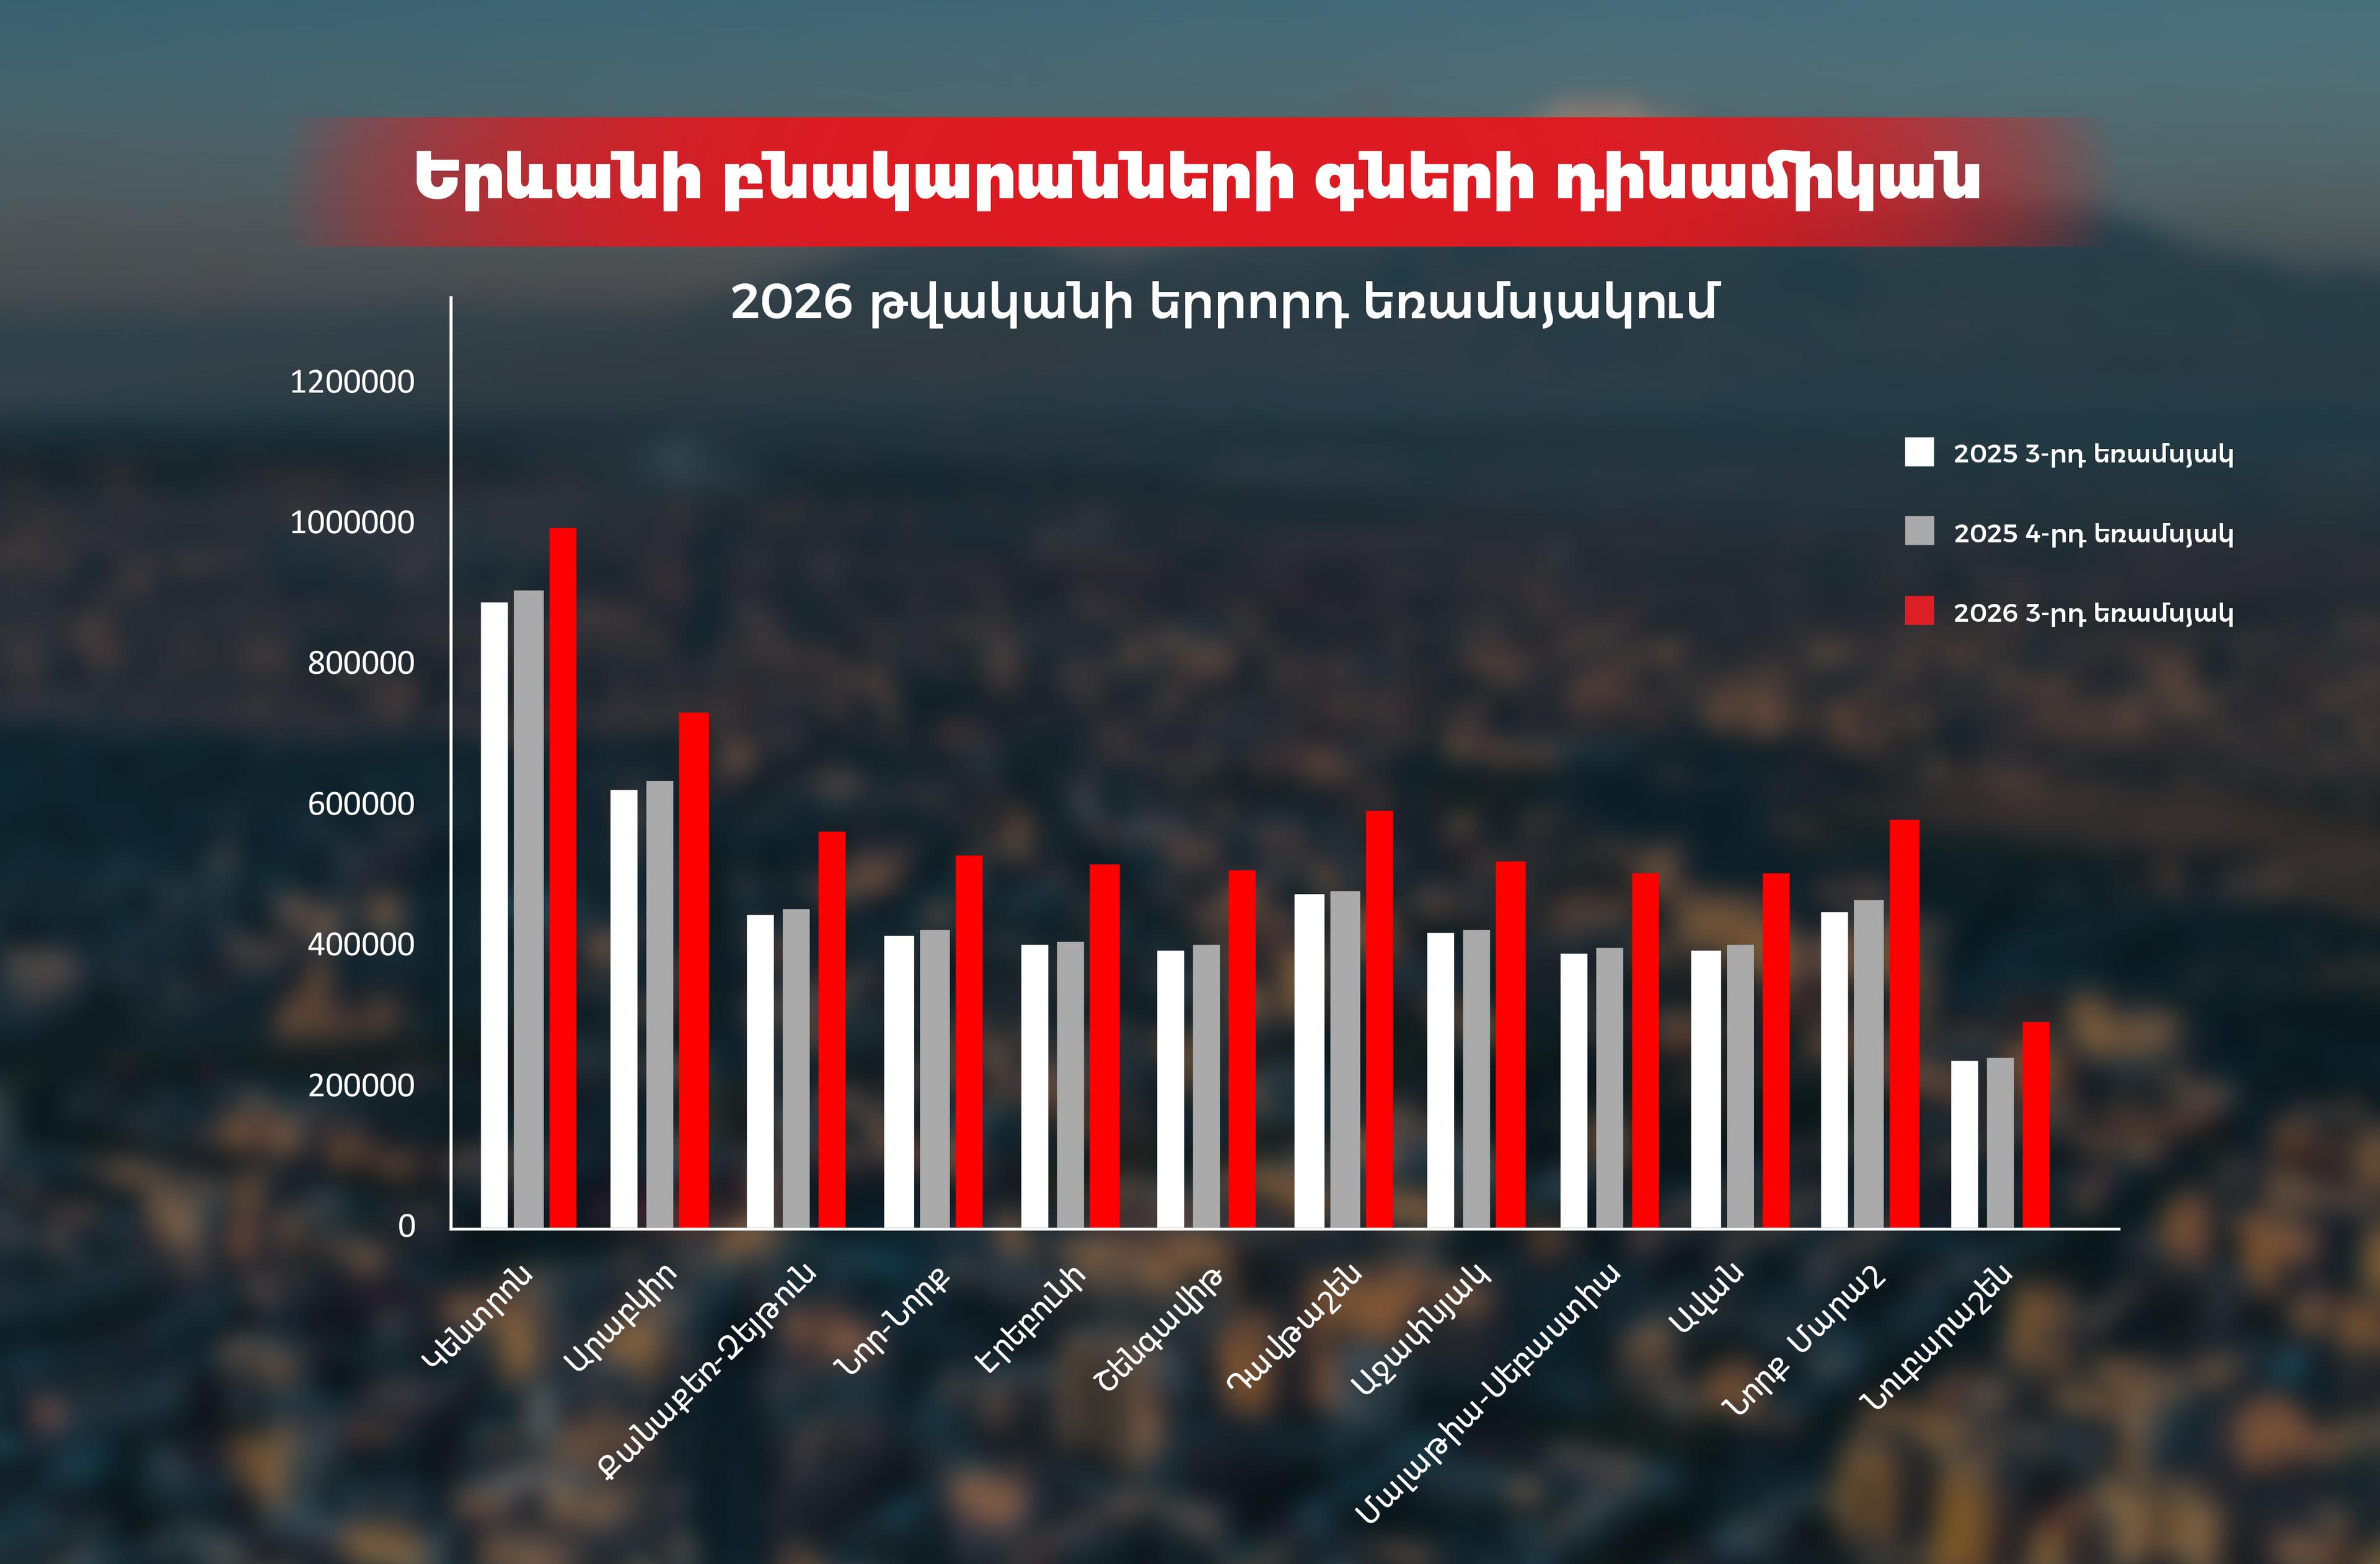
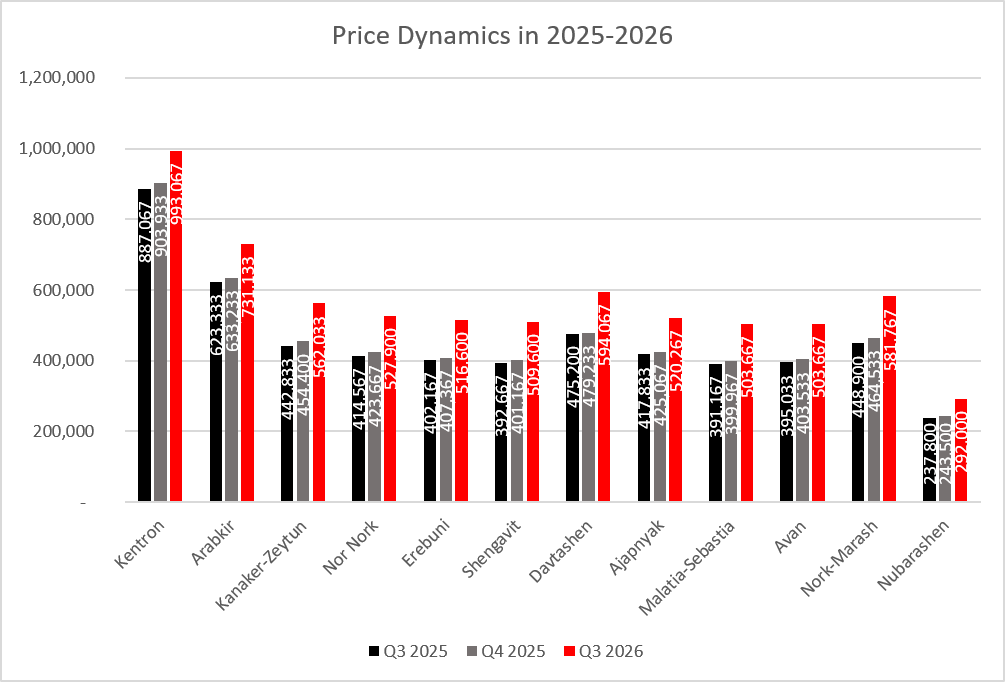
In the third quarter of 2026, average apartment prices were higher in all 12 administrative districts of Yerevan than in the same period of 2025. Growth rates varied, but positive dynamics were not limited to individual districts. In the context of the phased discontinuation of the income tax refund program, this picture may indicate market resilience and broader demand.
Alongside price growth, Central Bank data show that transaction activity in the real estate market was sustained. This suggests that the development of Yerevan’s market is gradually relying on a broader range of factors than a single state support program.
| Indicator | Result |
|---|---|
| Administrative districts where price growth was recorded | All 12 out of 12 |
| Annual growth range according to the chart | 11.9%–29.8% |
| Highest percentage growth | Shengavit — 29.8% |
| Highest average price | Kentron — approximately AMD 993,000/sq. m |
| Growth in residential real estate transactions in Armenia, according to Central Bank data, in the first half of 2026 | 46.1% compared with the same period of the previous year |
The Central Bank’s transaction indicator covers all of Armenia, not only Yerevan. It is presented as additional context for overall market activity.
For many years, the income tax refund program in Yerevan supported the purchase of newly built apartments with mortgage financing. After the program was phased out for new mortgages, an important question for the market was whether demand for apartments would be sustained as the previous incentive was reduced.
According to the chart, prices in all administrative districts of Yerevan were higher in the third quarter of 2026 than in the same period of 2025. The Central Bank also recorded that real estate demand and mortgage activity in Yerevan were sustained amid the phased discontinuation of the program. This does not mean that the program had no effect in the past. Rather, the data show that it is not the only source of market activity.
According to a Central Bank publication, the number of residential real estate transactions in Armenia increased by 46.1% in the first half of 2026 compared with the same period of the previous year. This indicator covers the entire Armenian market, not only Yerevan, and provides additional context by showing that transaction activity continued alongside price movements.
The highest average prices shown in the chart continued to be recorded in Kentron and Arabkir. At the same time, the fastest percentage growth compared with the third quarter of 2025 was observed in Shengavit, Nork-Marash, Malatia-Sebastia, and Erebuni.
This difference may point to a broader spread of appreciation within Yerevan’s market. Districts with higher prices continue to hold leading positions, while the rapid growth in several other districts may reflect increased interest in them or a gradual market revaluation.
However, high percentage growth by itself does not prove that demand in these districts increased to the same extent. Average prices may also be affected by the size of apartments sold, building type, stage of construction, apartment condition, and location. Therefore, the chart results show the recorded price dynamics in the administrative districts, rather than a direct comparison of the value of the same apartments.
The continued activity of Yerevan’s housing market may be driven by several interrelated factors:
The impact of these factors on prices has not been measured separately. They are considered possible market drivers based on a comparison of the chart data and official transaction statistics.
Price growth is also taking place amid an expansion in construction activity. New apartment supply may increase buyers’ choices and, over time, moderate price growth if the increase in supply exceeds the growth in demand.
Alongside the rapid growth in construction and residential development, the Central Bank has also noted the risk of possible market oversupply. Therefore, when assessing the market’s future development, it is important to monitor not only prices but also the volume of new supply and the continuity of transactions.
According to the data for the third quarter of 2026, average apartment prices increased in all the administrative districts of Yerevan presented. This growth continued after the phased discontinuation of the income tax refund program, while Central Bank data show that residential real estate transaction activity was also sustained during the same period.
The widespread price growth and continued transaction activity point to market resilience and development on a broader basis. They may strengthen investment confidence in Yerevan’s housing market, but they do not guarantee further price increases. Investment decisions should also take into account new supply, the administrative district, the specific project, and financing terms.
Subject of the Study
The analysis examines changes in the average price per square meter of apartments in Yerevan’s 12 administrative districts, comparing the third quarter of 2025, the fourth quarter of 2025, and the third quarter of 2026.
Baseline Data
The chart is based on the quarterly average prices specified for each administrative district. The analysis compares:
Numerical Calculations
The annual percentage change was calculated using the following formula:
(average price in Q3 2026 − average price in Q3 2025) ÷ average price in Q3 2025 × 100
The change compared with the fourth quarter of 2025 was calculated using the same method, with the average price for that quarter used as the baseline.
Interpretation Principles
The article distinguishes between:
The chart does not show price changes over time for the same apartments. The composition of transactions completed during a particular quarter may also affect average prices. The Central Bank’s transaction data cover all of Armenia and are not presented as an indicator for Yerevan alone.
Data Sources
Real Estate Market Analyses, Cadastre Committee of the Republic of Armenia
Central Bank of the Republic of Armenia: Residential Property Price Index, Q2 2026
Central Bank of the Republic of Armenia: Monetary Policy Program, Q4 2025
Authors and Tools Used
Authors: Serzh Nazaryan, Vardan Eloyan
Calculations and analysis: Article authors
Tool used: ChatGPT
ChatGPT was not the original source of the statistical data. The data were taken from the sources listed above, while the calculations and analytical conclusions were prepared and verified by the authors.