 2026-02-09
Dear reader,
The following summary report presents a concise overview of the quantitative and territorial distribution of transactions in the real estate market in 2025, covering both the primary (newly built) and secondary multi-apartment residential buildings. The information is based on official data and our calculations, ensuring a factual and accurate understanding of the subject.
The situation in the real estate market in 2025 can be described as a stabilization phase. The primary market is less active compared to the previous year, and the main reason for this is the termination of the income tax refund law in Yerevan. Like any self-regulating market, Armenia’s real estate market develops in cyclical logic. As noted in previous reports, the main indicator reflecting the real activity of the primary market is purchase-right transactions, which are presented in the graph below.
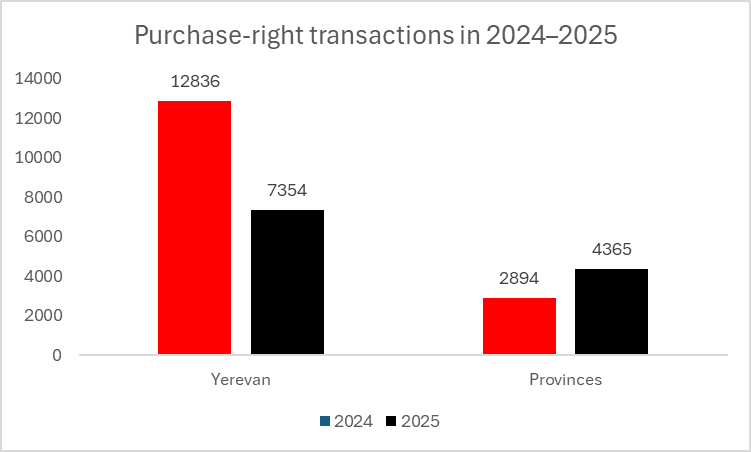
The data in the graph are calculated based on our analyses and studies. It shows that compared to 2024, market activity decreased by 25.5%, with the number of transactions dropping from 15,730 to 11,719. At the same time, it should be noted that when considering only the regions, an increase in activity is observed. Naturally, the decline becomes understandable when recalling the termination of the income tax refund law in Yerevan, which had previously stimulated market activity. To have a complete picture of the market, it is necessary to understand the distribution of transactions throughout Armenia and identify the most active zones.
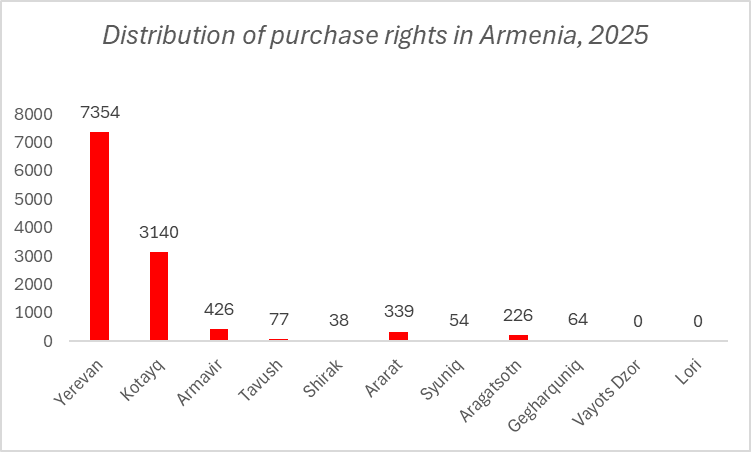
The graph shows that the main activity remains in Yerevan and its nearby regions, while other provinces record significantly fewer transactions. The capital is the most active zone, but since it is divided into administrative districts, it is important to understand the distribution of transactions to see which parts of Yerevan are more dynamic and which are less active.
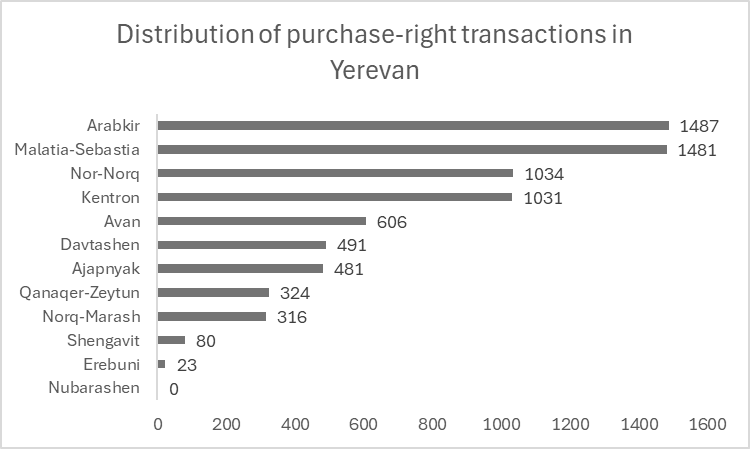
The graph indicates that the most active districts of Yerevan are Arabkir and Malatia-Sebastia, while the least active are Nubarashen and Erebuni. Market movement is mainly concentrated in large and central districts. One of the important indicators of the primary market is the distribution of purchase rights by apartment size, as it shows the structure of the market, the direction of demand, and development trends. This analysis provides a comprehensive view of market dynamics.
| Administrative district | 25-50sq. m. | 50-75sq. m. | 75-100sq. m. | 100-150sq. m. | 150sq. m.and more |
| Arabkir | 24% | 43% | 23% | 10% | 0% |
| Kentron | 13% | 47% | 22% | 14% | 4% |
| Qanaqer-Zeytun | 3% | 54% | 27% | 14% | 2% |
| Nor-Norq | 18% | 46% | 30% | 6% | 0% |
| Erebuni | 0% | 48% | 48% | 5% | 0% |
| Shengavit | 10% | 38% | 38% | 14% | 0% |
| Davtashen | 5% | 50% | 22% | 22% | 0% |
| Ajapnyak | 2% | 64% | 25% | 8% | 1% |
| Malatia-Sebastia | 7% | 58% | 28% | 7% | 0% |
| Avan | 14% | 45% | 29% | 9% | 4% |
| Norq-Marash | 4% | 43% | 23% | 22% | 7% |
| Total | 12% | 50% | 26% | 10% | 1% |
The table shows that Yerevan’s housing market is mainly concentrated on medium-sized apartments: 50–75 sqm apartments account for more than half, while 75–100 sqm apartments make up about one-quarter. The overall picture highlights that demand in the city is primarily shaped around medium-sized apartments.
To assess the activity of the secondary market, it is necessary not only to consider the total number of transactions but also to understand their structure. Specifically, it is important to distinguish how many transactions are made in the primary market and how many through the resale of already commissioned apartments (secondary market). Only this differentiation allows for a real picture of secondary market activity. According to our database and applied calculation mechanisms, the graph of secondary market activity is presented below.
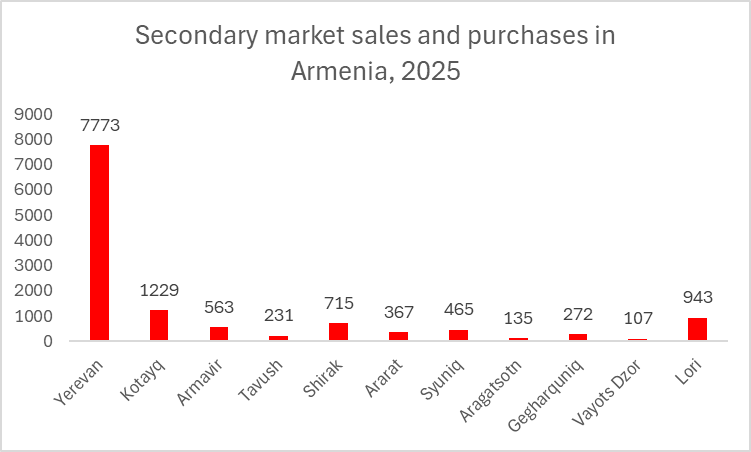
Beyond Yerevan, noticeable activity is also observed in Kotayk, Ararat, Shirak, and Lori. The transaction volumes in these regions are influenced both by population size and economic activity. For example, Kotayk and Ararat stand out due to their proximity to Yerevan and developed infrastructure, while Shirak and Lori are notable for their large cities (Gyumri, Vanadzor), where the housing market is more dynamic. Yerevan continues to remain the most active zone of Armenia’s real estate market in 2025. The majority of the population, investment flows, and transactions are concentrated here. Therefore, the secondary market in Yerevan is distinguished by high activity. Given that it is currently the most active zone, it becomes necessary to evaluate the distribution of activity by administrative districts. This approach allows for a more accurate understanding of the market structure and the dynamics of different areas.
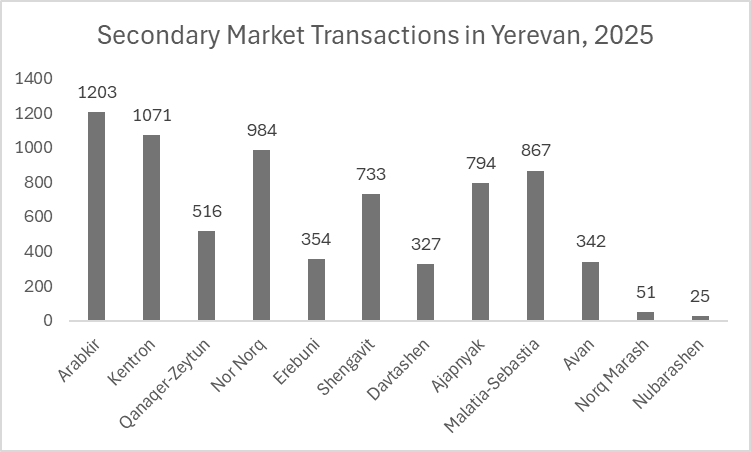
The graph of secondary market transactions in Yerevan shows that the most active districts are Arabkir and Kentron, where the number of transactions significantly exceeds others, while the least activity is recorded in Nubarashen and Norq-Marash, highlighting that the main demand is concentrated in central and more developed areas.
An important indicator in the real estate market is the quantitative expression of properties acquired and sold by foreign citizens. This indicator not only reflects the investment interest of foreigners in Armenia’s real estate but also serves as a tool for assessing the international attractiveness and trust level of the market.
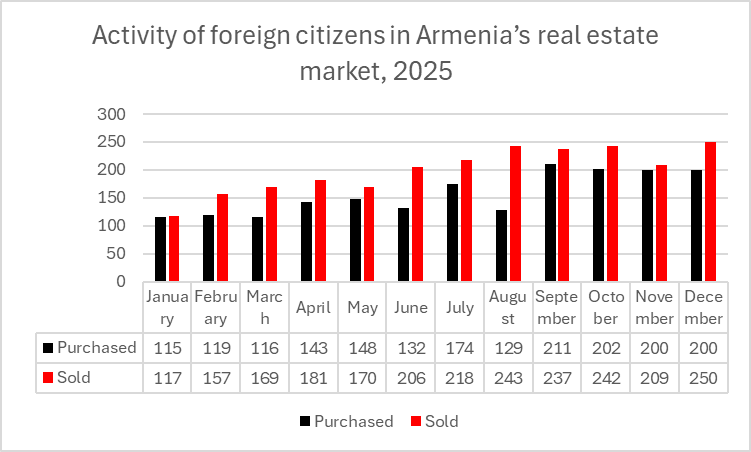
The data show that foreign participation in Armenia’s market had a growing trend during the year. At the beginning of the year, the number of transactions was relatively small (purchases: around 115–120, sales: 117–169), but in the middle of the year, activity increased (purchases: 143–174, sales: 181–206). August stands out with a significant difference, when the number of sales (243) greatly exceeded purchases (129), indicating foreigners’ exit from the market and active profit realization. In the last months of the year, the indicators reached their maximum (purchases: 200–211, sales: 209–250), showing that foreign participation peaked. The overall trend is that sales by foreigners exceeded purchases in almost all months, indicating that net investment acquisitions decreased. This means foreigners focused more on selling existing properties to fix profits or move resources to other markets. At the same time, the overall growth in transactions shows that foreigners remain active in the market, though their investment involvement has declined. Thus, foreign activity reflects not an increase in investment confidence but rather short-term exploitation trends of the market.


